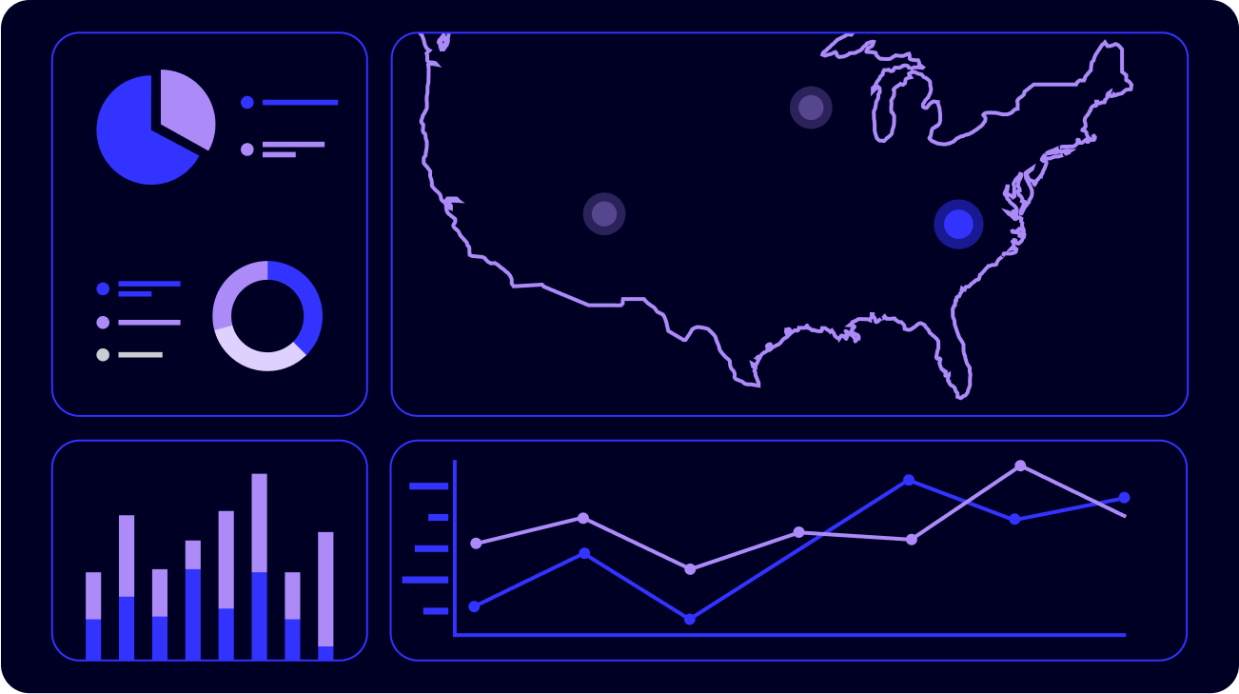
A disaster response organization built a dashboard using Foursquare’s high quality and privacy-compliant data to conduct directional analysis on population movement patterns and gauge the operational status of POIs in areas that are impacted by disasters. In-depth information is instrumental in ensuring that resources are delivered to impacted communities at the right place and at the right time.
Long data latency hampers timely supply delivery
Disaster response and recovery require understanding the economic impact of a national disaster in a particular area in order to efficiently provide the most necessary supplies. The agency requires anonymous and close-to-real-time data on trends in residents’ movement patterns and concentrations, as well as information on the types of businesses that were still operating in the area. Previously, the agency used data with a prolonged latency period, impeded real-time decision making and operational efficiency. Relying on non-timely data led to delayed awareness of changing conditions, resulting in a lag in response activities and the deployment of resources to affected populations. Additionally, it hindered the organization’s ability to plan delivery routes, allocate resources, and respond promptly to emerging needs. This obstacle delays the timely and effective delivery of essential supplies to those in need.
Near-real-time data helps enhance decision-making
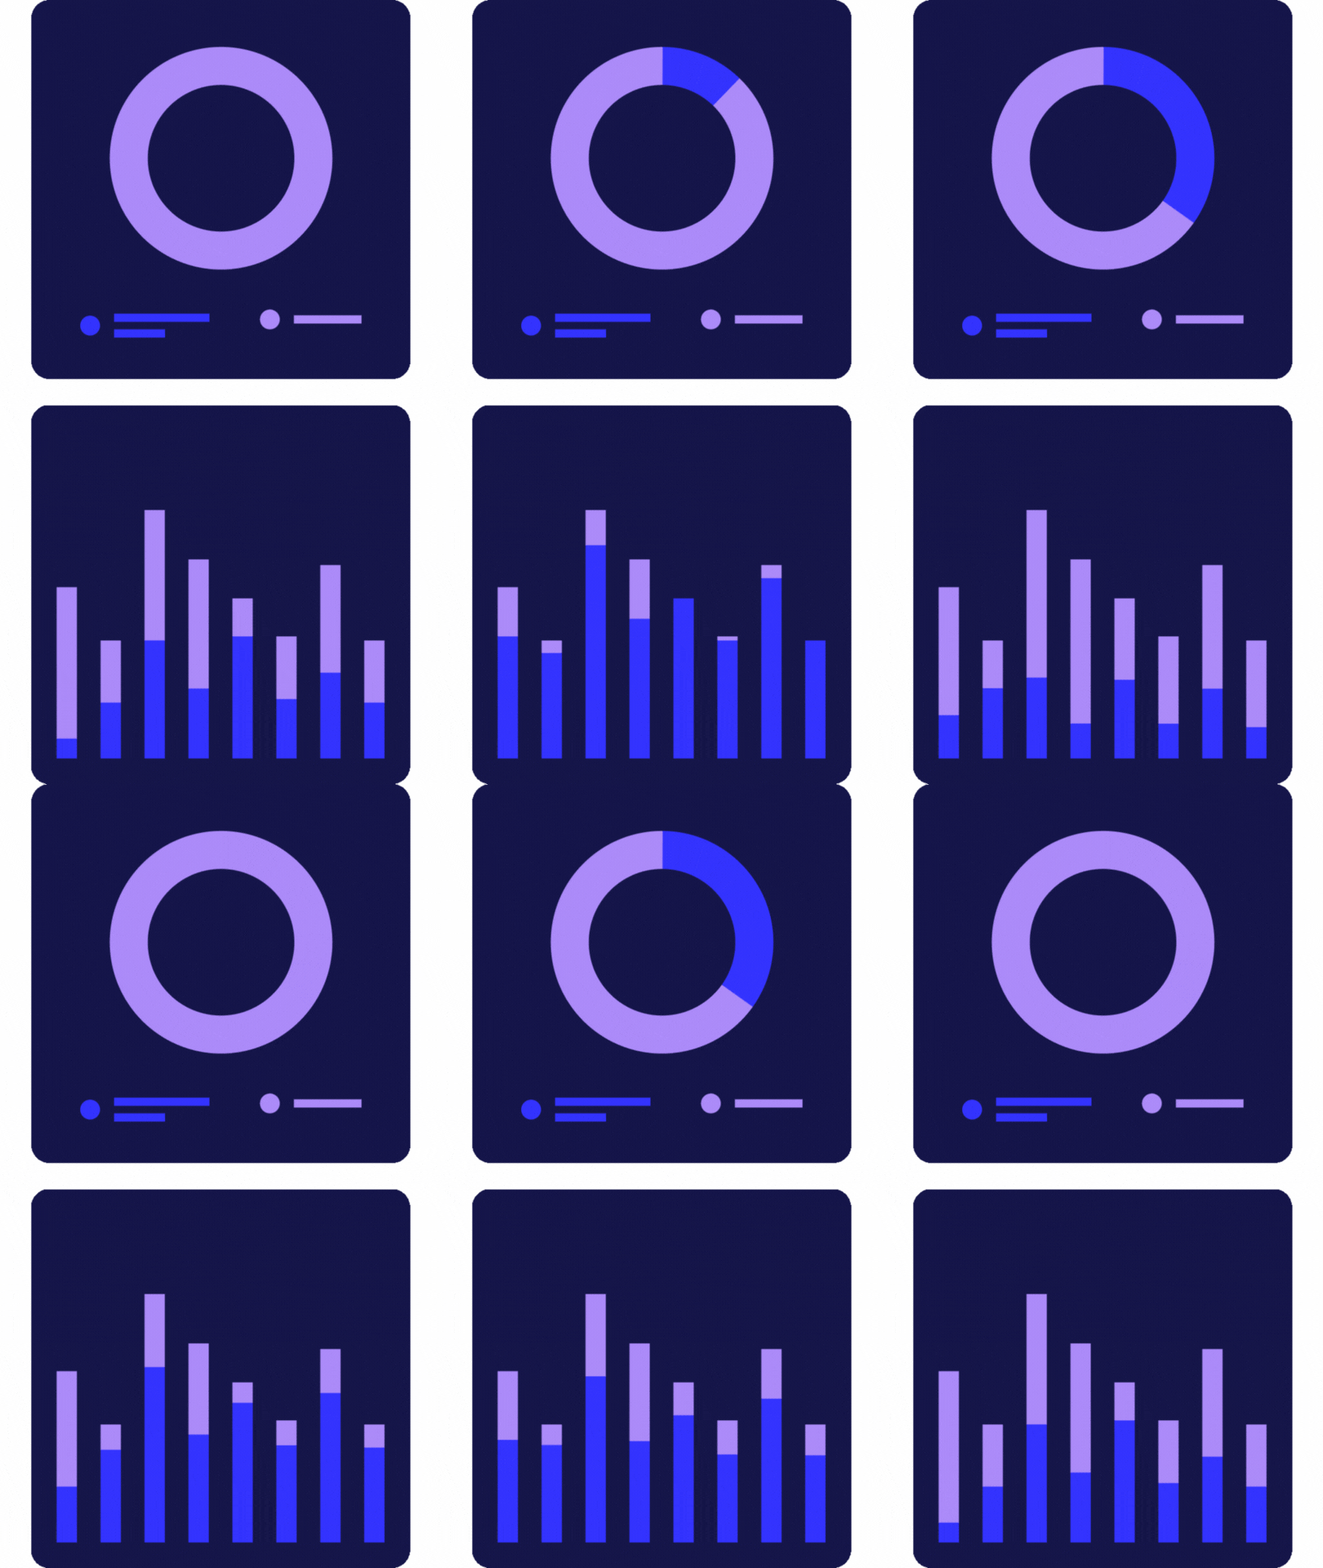
The agency built a dashboard powered by FSQ aggregated movement data. The data’s low latency helps the organization accurately visualize day-over-day population concentrations and overall movement patterns, predicting directionally where people will go next. The agency also leverages FSQ Places to obtain layers of contextual information that help with understanding the fine-grain effects of natural disasters. Aside from the freshness of data, another key reason Foursquare was chosen was its commitment to data privacy and ensuring all regulatory and consumer protections are in place to deliver high quality, compliant data.
Location intelligence powers real-world action

How does the dashboard work in practice? Let’s say a natural disaster takes place in Northern California and the agency needs to understand the movement of the population within a certain radius of the event. In partnering with Foursquare, key stakeholders have access to reliable data indicating to what extent people have evacuated (and to where), which local stores are operating (and what type), and much more. These insights then allow the organization to plan the best avenues for resource distribution and to identify where there may be populations without access to necessary supplies.
Ultimately, with access to aggregated movement and POI data, disaster response planners and other key decision-makers are able to conduct much more detailed and nuanced analyses, driving more beneficial and impactful emergency response decisions.
