In today’s complex advertising landscape, understanding the true impact of omnichannel campaigns is crucial for marketers. Foursquare Attribution allows advertisers to measure and optimize their campaigns’ effectiveness in driving foot traffic to stores in real-time. For example, if a fast-food chain runs a campaign to promote a new menu item, Foursquare Attribution can quickly show whether the campaign is driving an increase in foot traffic, in which geographies, and through which channels.
However, the consumer journey has become increasingly complex, with seamless transitions between online shopping, in-store visits, and hybrid options like ordering for in-store pickup. Recognizing this, we’ve enhanced Foursquare Attribution with Sales Impact features. By integrating transaction data with our foot traffic insights, we now offer a comprehensive view of the customer journey from ad exposure to purchase. This allows advertisers to track not just increased foot traffic but also resulting sales, providing a more accurate picture of campaign ROI.
Connecting foot traffic to sales data required us to innovate, rebuilding our entire data processing pipeline foundation and introducing enhancements to our methodology and checkpoints across the pipeline to ensure the metrics we produce are reliable. In this blog, we will walk through the various stages of our enhanced pipeline, enumerate the new metrics we’ve added in launching Sales Impact, and delve into the benefits this newly designed pipeline offers our customers.
A Better Pipeline For Better Attribution
At its crux, our Attribution pipeline matches ad exposure events (also known as impressions) to store visits & transactions and generates metrics that provide insights into the consumer behaviors that can be attributed back to the ad exposures. To begin, brands and advertising agencies configure their omni-channel campaigns to be measured by Foursquare. These campaigns can be for the brand’s nationwide chain, specific DMAs, or a specific subset of their stores. Once the campaign is configured and running, publishing partners send exposure data to Foursquare.
Foursquare then triggers the processing pipeline, which comprises the following steps: input generation, normalization, matching, scoring, and projection. Let’s dive in and uncover what it takes to have the most trusted and accurate attribution solution in the market.
How It Works: A Deeper Dive

1. Input Generation
Let’s walk through how we generate the three key inputs that are essential to our attribution pipeline: Impressions, Visits, and Transactions.
Impressions
We provide our partners with a variety of methods to send us impressions. Direct digital impressions are captured through our HTTP “Pixel” endpoint, which tracks user exposures in real time. For non-digital impressions, we offer partners the ability to share impression data via SFTP or S3. We also infer impressions from other datasets in some cases. For example, in the case of television, we infer impressions by joining viewership data, which tells us who was watching and when, with ad run-logs that indicate what ads were being shown at those times. For out-of-home (OOH) advertising, impressions are tracked by joining our movement data with the location of the billboards.
All impressions, regardless of the source, are canonicalized to a common format. The canonicalized impressions contain information about who was exposed, when the exposure occurred, and which campaign is this impression a part of. Each partner also tags additional metadata to each impression, which typically captures other information about the impressions, such as the media type used, and the segment targeted.
Visits
Our ability to precisely measure a store visit in the physical world is made possible by our comprehensive Places dataset, our superior Stop Detection technology and our proprietary Snap-to-Place algorithm trained on ground truth generated from our consumer apps. We process GPS pings from a combination of 1p and carefully vetted 3p sources for consumers’ control over the data collected and apply our proprietary models to generate visits.
First, Foursquare’s new Places Engine (which we will cover in a subsequent blog post), is built on our battle-tested crowdsourcing methodology and uses a combination of inputs from Foursquare owned-and-operated mobile app users and digital agents to generate highly accurate Places data that is continuously refreshed. Our Places data is specifically curated from trusted sources and validated by manual & automated processes against publicly available information about those brands. This is particularly important because any gaps in places datasets can inevitably lead to inaccurate visit detection.
Second, we aggregate GPS signals from both our own consumer apps and vetted third-party partners. We run our proprietary Stop Detection algorithm on the GPS signals to identify clusters of GPS signals that indicate a certain dwell time at a specific location to identify a stop. This is a crucial step in detecting visits as it allows us to capture true visits as opposed to someone driving by or sitting in traffic nearby.
Third, detecting a visit to a place from the GPS coordinates of a stop point may seem like a trivial task, especially if the approach is to predict a visit based on the proximity of the GPS coordinates recorded by a mobile device to that place. However, this approach is inherently flawed as it does not acknowledge the erroneous nature of the GPS signals. For instance, when you open up your phone in a dense location, more often than not, it shows you as being on the other side of a road or in an adjacent building. As visualized in the graphic below (where blue dots represent the check-ins to a place represented by the blue square), you’ll see the spread of GPS pings recorded for confirmed check-ins to a place.
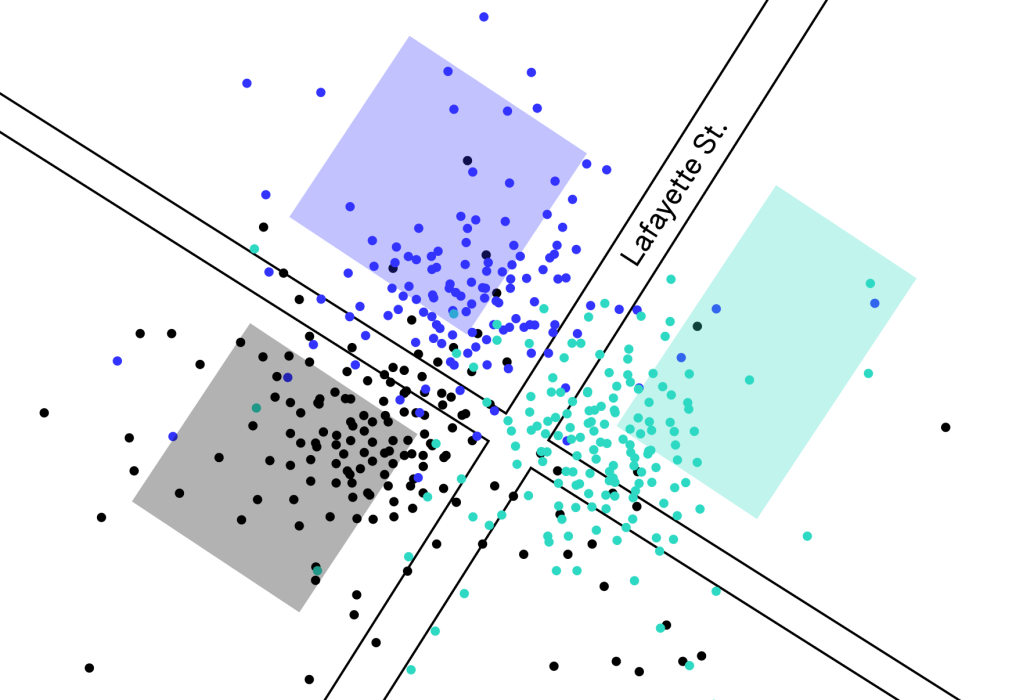
If you were to strictly use the GPS signal to record visits with a proximity radius, the resulting visits are often inaccurate. Instead, in addition to the GPS signals, Foursquare uses a variety of signals, such as the time of the day, the categories of the places nearby, and leverages the ground truth check-ins (confirmed visits verified by humans) generated by Foursquare owned-and-operated mobile apps to build a model to predict visits. This model is then used to accurately predict visits from the stop points.
While we use first and third-party data, it is important to mention that we vet each partner provider for accuracy and quality by comparing the pings of overlapping users with our first-party quality data. This allows us to calibrate each provider to ensure that only high-quality data enters our panel.
Transactions
Agreements with leading transaction data providers enables Foursquare to offer over 2 billion annual transactions. We ingest transaction data and use our proprietary algorithms to match them against Foursquare Places. However, it is not a simple task to map transactions to Foursquare Places. Transactions have information encoded about them in very fuzzy strings. This makes it challenging to accurately determine the place at which the transaction was recorded. To solve for this, we’ve built a unique methodology to map transactions to Foursquare Places that not only looks at each transaction in isolation, but also takes into account patterns in a series of transactions from each card to accurately identify places where they occurred. As a result, a transaction string with very little information such as “SPEEDWAY 09582 CINCINNATI CINCINNATI OH” can be accurately mapped to “Speedway 2713 Williams Ave Cincinnati OH 45209”, even though there are multiple Speedways in Cincinnati. Our transaction data coverage includes daily credit and debit transactions corresponding to 450+ chains across the United States.

2. Normalization
Normalization is the process through which we scale visitation and transaction behaviors observed within our panel to reflect the real-world population. This is an important step in the process as it helps set the baseline for campaign-specific impact calculations. Normalization involves eliminating inherent data biases, such as demographic bias, behavioral bias and also ensuring we have consistent membership of users in our panel.
Ensuring a Stable Panel: Tenure Filters
While our first-party visitation panel and our transaction panel are stable, third-party visitation data tenure can vary. As we want to eliminate inaccuracies arising from panel members whose activity only appears sporadically within the panel, we first filter out users who do not have consistent activity over time.
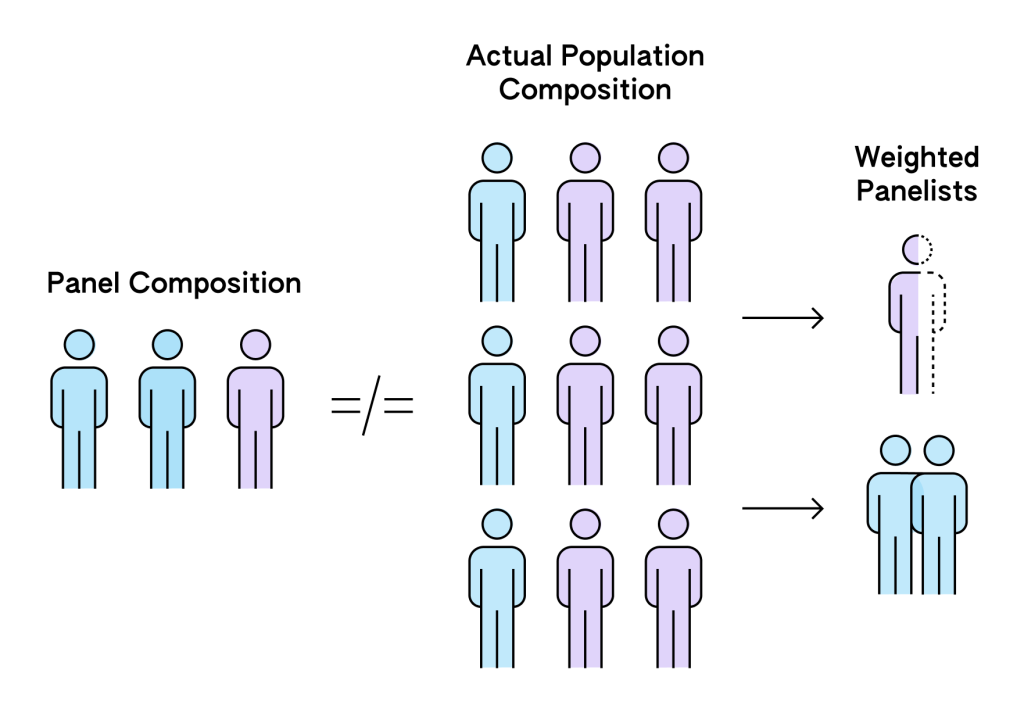
Eliminating Demographic Bias: Census Weights
Imagine a hypothetical scenario where our panel has 70% male users and 30% female users, but we observe that the actual population is evenly split 50/50. We have a solve for this with a weighting algorithm that adjusts the importance of each user’s data. In this hypothetical, this would adjust such that the female users’ data is given more weight, effectively balancing out the gender representation. This means that in this hypothetical analysis, the behavior of a female user might be counted as 1.67 times as important as a male user’s behavior, ensuring our overall results reflect a 50/50 gender split. We use census weighting to eliminate this demographic bias.
We do so by using government-published census information at a census block group level. We identify all the users in the panel belonging to a census block group using a proprietary algorithm, predict their demographics from their visitation/purchase behavior, and then add the appropriate weights to eliminate the bias. Then, we further scale the weighted panelist to reflect the overall population.
Eliminating Behavioral Bias: Place weights
We also correct for behavioral biases in our panel’s visitation and purchase patterns to places and chains. For instance, let’s imagine a hypothetical scenario where our panel shows a disproportionately high number of visits to coffee shops compared to the general population. If panel users visit coffee shops twice as often as the average person, we might apply a specific weight to coffee shop visits, bringing our projected visitation patterns more in line with the general population’s behavior. To achieve this, we utilize our transaction and first-party visitation data to understand trends and validate against publicly verifiable information. This additional step to eliminate bias and ensure accuracy further underscores the importance of having high quality first-party data.
Validating Against Ground Truth
We frequently run tests to ensure that our normalized output is aligned with ground truth. First, we validate that the trends in the scaled-up transactions corresponding to various brands are aligned with data in public financial statements. Second, we ensure that the trends in the visitation panel align appropriately with the transaction trends for different chains and categories. This level of validation allows us to be confident that our dataset is aligned to real-world behavior.

3. Matching
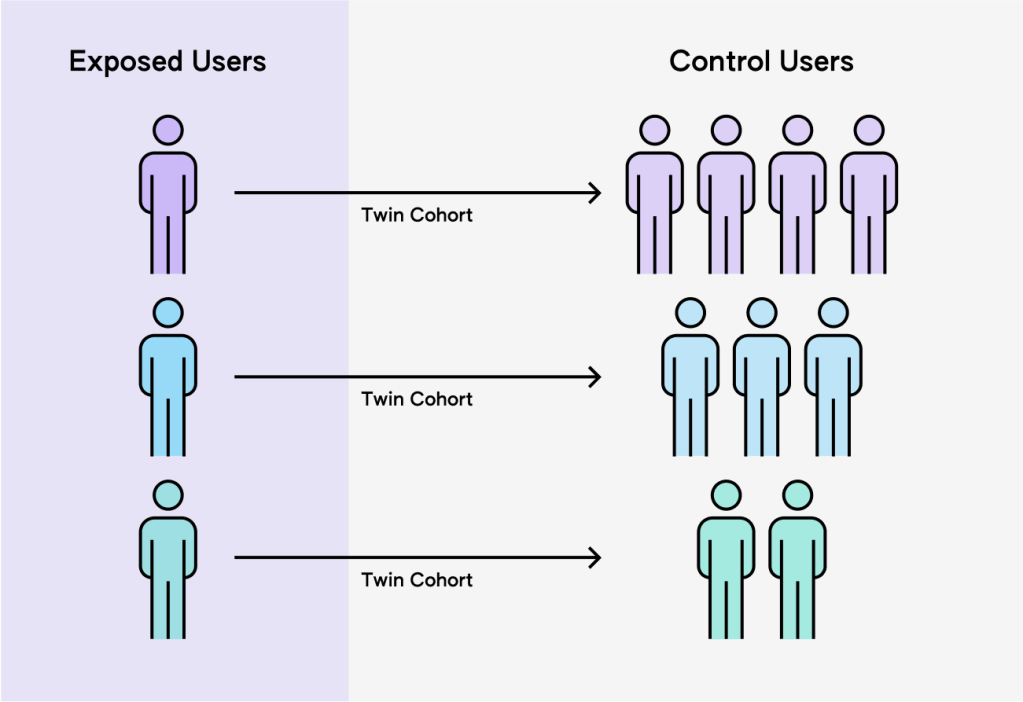
Our next step is matching, which is a process through which we segment the users in the Foursquare panel into treatment and control groups based on whether or not they are exposed to an ad and identify a modeled twin cohort for every user in the treatment group with ones in the control group. It is a two step process:
First, we join ad impressions with our panelists, to identify the subset of the users in our panel who have been exposed to the campaign. We leverage our proprietary ID Graph to map identifiers to the users in the Foursquare panel. Then, we start the process of matching users exposed to the campaign, with cohorts of control group users who haven’t yet been exposed. The matching process factors in demographic information, geographic area, past visitation behaviors to specific chains and categories, and more. We use these cohorts of mirrored users to measure behavioral differences resulting from the exposure to the campaign. This process allows us to measure not only the average treatment effect (how the campaign affects all exposed users on average), but also the conditional average treatment effect. For instance, whether a specific coffee campaign is incrementally effective in driving impact with urban dwellers in their thirties who already frequent coffee shops, is baked into the treatment effect.

4. Scoring
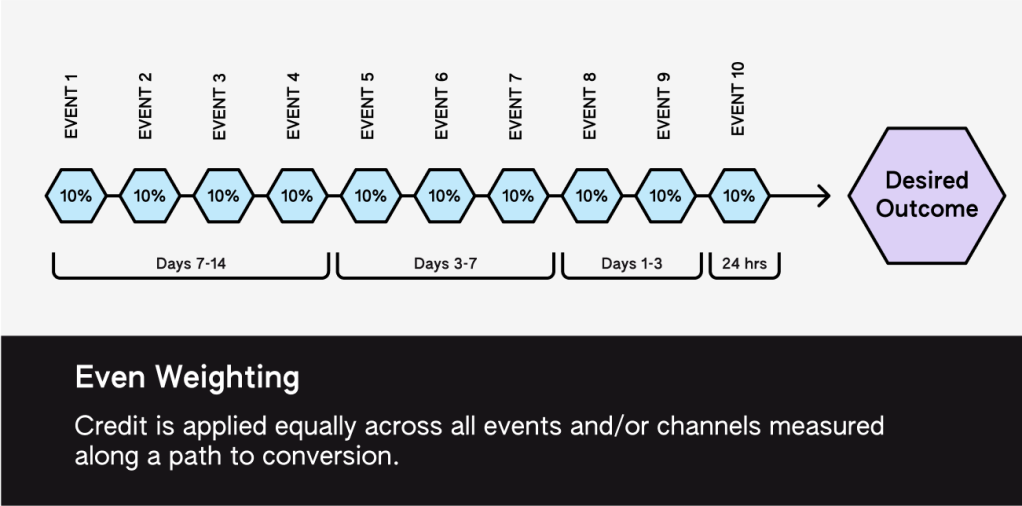
For each campaign, we work with the advertiser to define a “conversion window” or a defined time period after an ad impression during which a store visit or purchase can be attributed to that ad exposure. The length of this window can vary depending on the type of campaign and the advertiser’s preferences, but typically ranges from a few days to a few weeks. For each recorded visit or purchase, we look at the user’s impression history and identify all visits or purchases that fall within the conversion window after an impression is recorded. When multiple impressions share a common conversion window, we use an even-weighting, multi-touch approach to assign equal, fractional credit to all impressions corresponding to the visits or transactions in that period. For example, if a user saw three ads from the same campaign before making a store visit or purchase, and all three impressions fall within the conversion window, each impression would be credited with 1/3 of the visit and/or purchase.
To determine the incremental impact of the advertising, we compare the visit or purchase rate of users exposed to ads to a similar group of users who were not exposed. However, this does not paint the complete picture for the campaign, as our panel only represents a subset of the overall population exposed to the campaign. That’s where the Projection step plays a crucial role.

5. Projection
Projection weighting is the final, but most consequential step in our processing pipeline. It is our way of ensuring accurate insights about the entire campaign. For example, let’s say an athleisure brand launched an omnichannel campaign across two publishers and the hypothetical match rate with our panel is as follows:
- Streaming Audio Publisher: 1000 total impressions, 100 matched impressions, 10% match rate.
- Social Publisher: 800 total impressions, 50 matched impressions, 6.25% match rate.
At first glance, it seems the streaming audio publisher is outperforming, but this apparent advantage is simply due to a higher match rate with our panel. Without appropriate correction, we could overestimate the streaming audio publisher’s impact in the campaign and underestimate the social publisher’s contributions. Moreover, we need to account for how users were exposed across channels. Let’s say, we have
- 80 matched impressions are from users who saw only Streaming Audio ads.
- 40 matched impressions are from users who saw only Social Ads.
- 30 matched impressions (20 from Streaming Audio, 10 from Social Ads) are from users who saw ads on both platforms.
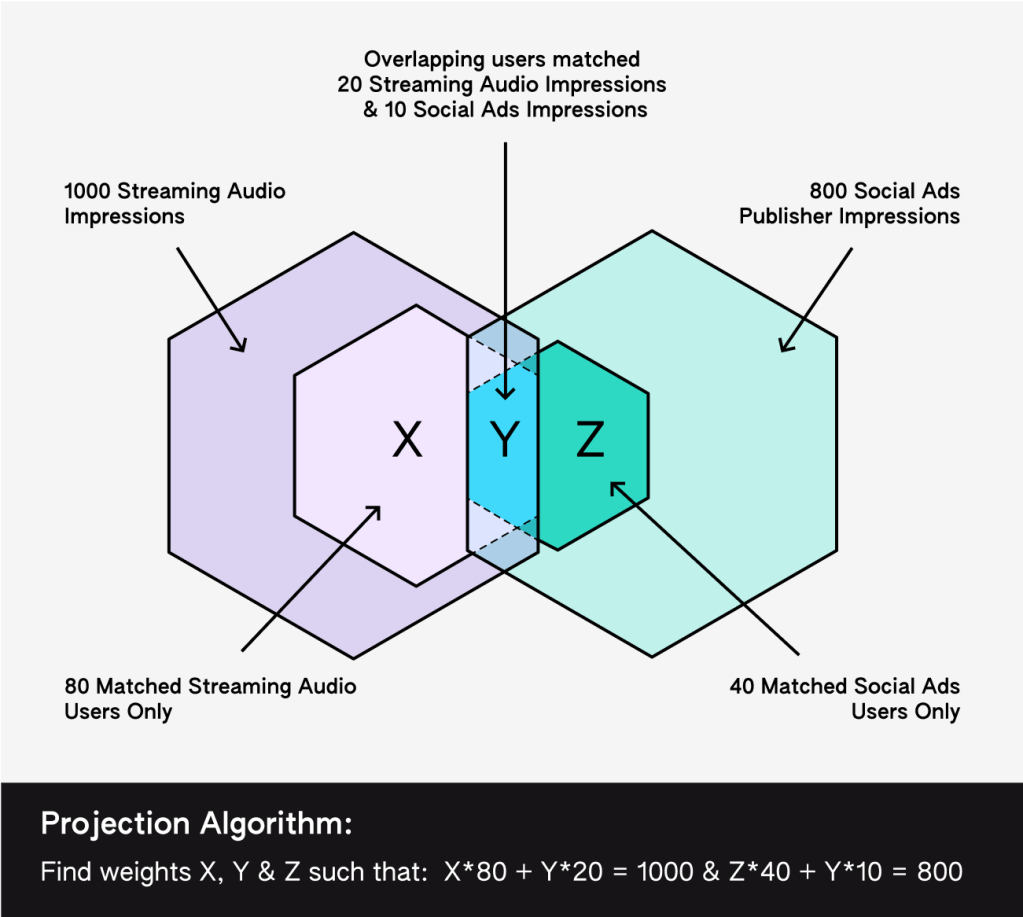
Understanding these segments is crucial because it allows us to accurately attribute the impact of each channel while accounting for the overlapping exposure that occurs in multi-channel campaigns. Let us walk through how our projection weighting algorithm addresses these challenges using the example above:
- We start by looking at the matched impressions corresponding to each of the three segments we identified above: users who only saw Streaming Audio ads (80), users who only saw Social ads (40), overlapping users who saw ads on both platforms (20 on Streaming Audio and 10 on Social ads.)
- Our algorithm then finds the weights for each such segment such that when we apply those weights to the census weighted panelists in that segment, the total weighted impressions of the Streaming Audio channel equal 1000 and those of the Social Ads channel equal 800.
- We ensure the weights are chosen in a way to minimize distortion of the original data.
The resulting weights are then applied to each census weighted panelist based on the segment they are a part of, to ensure accurate representation of impression & reach targets while maintaining appropriate demographic and geographic distribution aligned with the campaign’s intended audience.
This carefully calibrated process provides our clients with a comprehensive view of their campaign’s performance. By extrapolating from our matched panelists to the overall campaign, we ensure fair representation of each channel’s contribution, regardless of varying match rates or partial visibility into total impressions. This methodology maintains the integrity of the campaign’s targeted audience characteristics, enabling us to deliver attribution reports that truly reflect the full impact and success of omnichannel campaigns.
Putting It All Together – Actionable Metrics
Now that we have delved into each pipeline step of how we produce accurate Attribution results, let’s discuss the output metrics themselves. Foursquare’s comprehensive measurement approach provides a full-funnel view of advertising impact, tracking the customer journey from initial ad exposure to final purchase. Our metrics offer advertisers a complete understanding of their campaign’s real-world effectiveness.
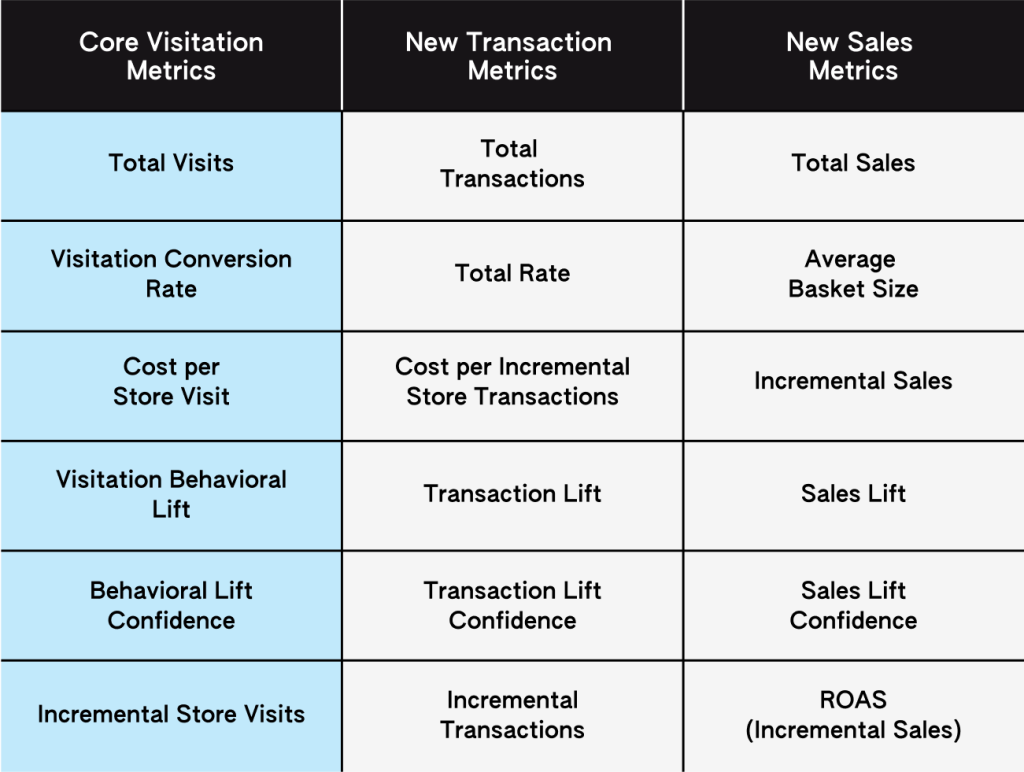
We begin with our core visitation metrics, which quantify foot traffic fundamentals such as total visits, conversion rates, and our proprietary visitation behavioral lift. Building on this foundation, our new transaction metrics delve deeper, enumerating purchases and quantifying the incremental transactions driven by each campaign. For a thorough financial perspective, our new sales metrics complete the picture, encompassing total sales, average basket size, and return on ad spend (ROAS). In this chart, you’ll see just some of the numerous metrics available within our Attribution reports.
In aggregate, these metrics across visitation, transactions, and sales offer a holistic view of a campaign’s influence on the customer journey, extending beyond just driving a consumer to your store to capture actual financial outcomes. By providing insights into not only what occurred, but what can be directly attributed to advertising efforts, Foursquare empowers clients to make data-driven marketing decisions. Whether the focus is on foot traffic, transaction volume, or revenue generation, our metrics suite is engineered to articulate each campaign’s success story through robust, actionable data.
Engineering Excellence for Better Customer Outcomes
At Foursquare, our commitment to innovation extends beyond metrics to the very core of our technology. As a part of this initiative, we rebuilt our longstanding MapReduce pipeline from the ground up, leveraging Spark and the modern data stack.
This overhaul has transformed our data processing capabilities, addressing a critical bottleneck in our system. More specifically, it could take several days to gather all necessary information for data processing and required a significant amount of time to perform a daily refresh of metrics for all campaigns, preventing us from using a greater portion of data as it arrived over multiple days. Our new pipeline can now process a day’s visits incrementally within hours, solving for this problem. This leap in processing speed translates directly to benefits for our clients: more accurate reports and the ability to reach feasibility in smaller geographical areas. It’s a prime example of how our continuous engineering improvements lead to tangible advantages for our customers, positioning Foursquare at the cutting edge of digital attribution technology.
Conclusion: Pioneering the Future of Digital Attribution
Foursquare’s new attribution pipeline represents a significant leap forward in connecting digital advertising to real-world outcomes. Our modular design, with checkpoints at various stages, enhances observability and explainability, providing increased transparency and adaptability. This architecture, coupled with our unique advantage of high-quality first-party data, allows us to extract reliable signals from noisy third-party sources, setting us apart in the industry.
For our clients, these advancements translate into more comprehensive and faster insights, expanded geographical reach, and enhanced accuracy. As the line between online and offline consumer behavior continues to blur, Foursquare’s solution stands ready to illuminate the complex path from ad exposure to purchase. We’re not just measuring campaigns; we’re empowering businesses to optimize their real-world impact, turning data into decisive action in an increasingly digital world.
Learn more about Foursquare Attribution and get started today
Authored by: Vikram Gundeti, Grace Fletcher, Kumar Somnath, Frank Shi